Processed Foods In Context: An Analysis Of Consumer Purchasing Patterns, Food Classification Approaches, Nutrition Density & Price
September 25, 2026
Research Type
Topics
Abstract
This report summarizes findings from an analysis commissioned by the International Food Information Council (IFIC) designed to quantify the prevalence of processed foods in U.S. retail grocery purchases and to assess nutrient density within and across food processing classifications using the Nova classification and the Nutrient Rich Food Index 6.3 (NRF6.3) approaches. The analysis focuses on more than 40,000 products across five categories frequently purchased by U.S. households with children: cereal, snacks, fresh dairy, prepared meals, and fruits and vegetables. Findings show that processing classification approaches alone do not reliably predict nutrient density as food and beverage products classified as Nova 4 represent a substantial share of sales in multiple food categories and NRF6.3 scores vary widely.
Introduction
While the International Food Information Council (IFIC) Report, Digital Discourse On Processed Foods: Insights From Consumer & Key Opinion Leader Commentary, indicates that the digital discourse around processed foods is highly visible and emotionally charged, it reflects what people say, rather than what they purchase or consume. 1 This new analysis was intentionally designed to move beyond conversation by evaluating real-world purchasing behavior across commonly consumed food categories by pairing a processed food classification based on ingredient attributes with a standardized nutrient density score derived from Nutrition Facts Panel. Together, these approaches demonstrate how processed foods are actually purchased at retailers and highlight the diversity in nutrient density across foods classified as highly processed.
Objectives & Methods
The objective of this research was to provide an assessment of processed food purchases and their nutrient density, with an emphasis on categories frequently consumed by U.S. households with children under 18 years of age. The five food categories included in this research were hot and cold cereal; snacks; fresh dairy; prepared meals (frozen and shelf-stable); as well as fruits and vegetables (frozen, canned, dried, 100% juice). Subcategories included in each of these categories are detailed in Appendix A.
The Nova classification system is among the most frequently used frameworks in the scientific literature for examining food processing and potential health outcomes. 2 Because packaged food labels do not specify the technological purpose of ingredients, applying Nova within retail databases requires an ingredient-based operational definition that can be consistently implemented across thousands of products. 3,4
For this analysis, IFIC partnered with NielsenIQ (NIQ), a global leader in consumer intelligence, combining comprehensive retail measurement data with advanced analytics and NielsenIQ Product Insight’s deep attribute data to provide a detailed view of consumer purchasing behavior. NIQ completed this analysis using its product databases and applying a Nova 4 classification to ingredient declarations, whereby any product containing specified additives (e.g., flavors, colors, emulsifiers, sweeteners, or thickeners) was categorized as Nova 4 or “ultra-processed food” or “UPF.” Any reference to the term “UPF” is used to refer specifically to this Nova 4 classification as operationalized in the NIQ database.
The Nutrient Rich Food Index (NRF), a widely used, validated, peer-reviewed nutrient profiling model, was used to assess the nutrient density of foods. 5 Several versions of the NRF exist, differing in the number of nutrients included to encourage in the calculation; in this analysis, the NRF6.3 model was used because all nutrients included in the score are required to be declared on the Nutrition Facts label, allowing for consistent evaluation across packaged foods in the NIQ database. NRF6.3 scores were calculated using the percent Daily Value (DV) of six nutrients to encourage (protein, fiber, potassium, calcium, vitamin D, and iron) and three nutrients to limit (saturated fat, added sugar, and sodium) per Reference Amount Customarily Consumed (RACC).
When calculating the Nutrient Rich Food Index, nutrients to encourage are sometimes capped at 100% DV. 6,7 As indicated in the scientific literature, capping nutrients to encourage at 100% DV is an approach to prevent disproportionately high contributions from a single nutrient from driving overall scores. As a validation step in this analysis, NRF6.3 scores were calculated with no capping and with capping nutrients to encourage at 100% DV. As there was no significant difference between the scoring, the analysis was completed and reported with no DV capping on nutrients to encourage.
Nova 4 and non-Nova 4 as well as NRF6.3 analyses could only be performed on products with complete ingredient and nutrition labeling in the NIQ database. As fresh produce and deli-prepared meals often do not carry a Nutrition Facts label, these products were excluded from this assessment as were food items with annual U.S. sales below $10,000.
In addition to descriptive analyses, linear regression models were used to estimate differences in nutrient density and per-unit price between Nova 4 and non-Nova 4 products, both in aggregate and within nutrient-density tertiles. Models were specified under availability, purchase frequency (unit-weighted), and expenditure exposure (dollar-weighted) approaches to distinguish differences in total product availability from differences in actual purchasing behavior within each of the five categories.
Key Findings:
Nova 4 classified foods are prevalent among consumer food purchase patterns, anchored in core grocery and frozen departments.
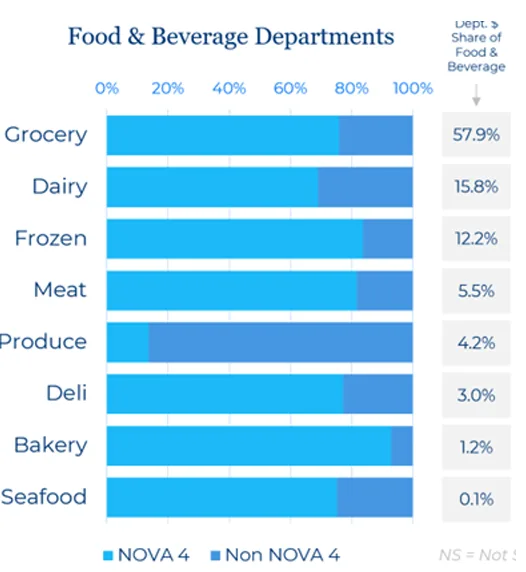
As depicted here, Nova 4 food products account for roughly three quarters of total U.S. food and beverage sales, with grocery/shelf-stable and frozen departments alone representing more than 70% of that volume. In the five categories assessed in further detail, cereals classified as Nova 4 make up 92% of total cereal sales and 85% of all cereal items. Similar Nova 4 percentages are observed for prepared meals (96% of sales 90% of items), with lower figures for snack foods (76% of sales, 74% of items). These analyses highlight that across categories often considered “core” to family shopping (as defined by NIQ data), Nova 4 accounts for the majority of food purchases. As a result, dietary recommendations and discussions about significantly reducing or eliminating Nova 4 foods must be grounded in the realities of current consumer behavior, rather than treating these products as easily avoidable given current purchase behaviors.
Classification as Nova 4 does not consistently distinguish between higher- and lower-nutrient-dense foods.
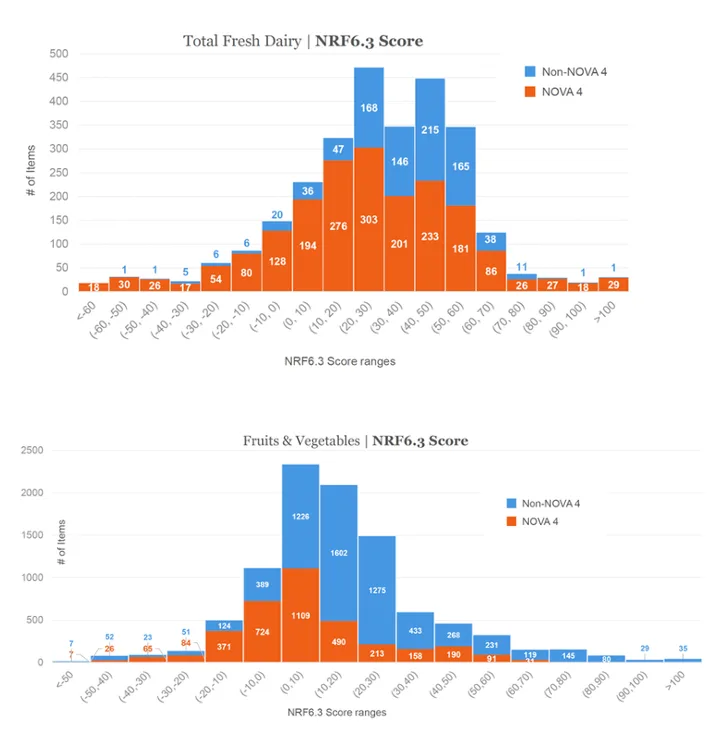
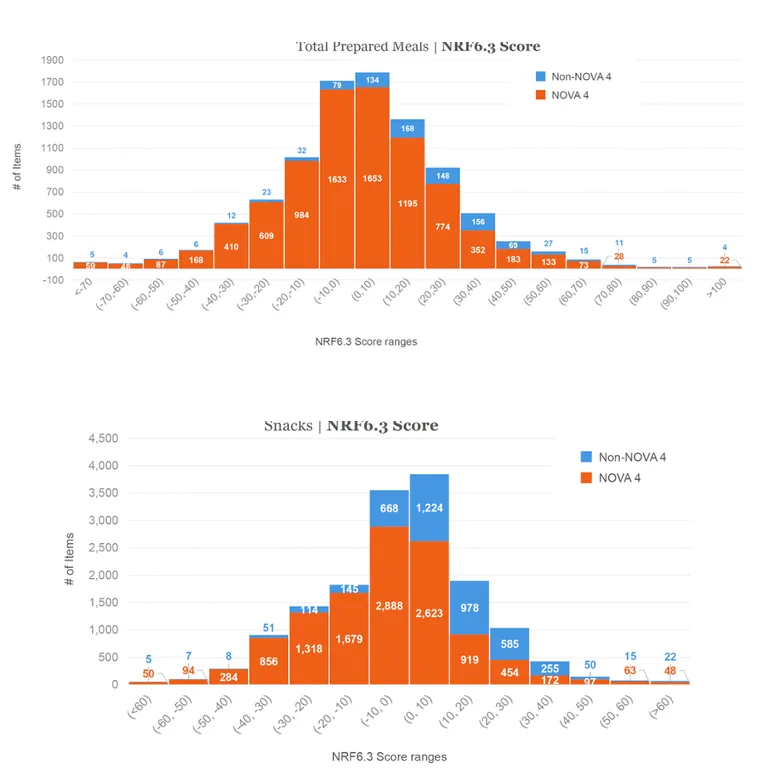
While average NRF6.3 scores were higher among non-Nova 4 classified foods in all five of the categories analyzed, the score distributions reveal substantial overlap between Nova 4 and non-Nova 4 foods. Across all categories, nutrient density spanned wide ranges regardless of Nova 4 or non-Nova 4 classification, indicating that both higher and lower nutrient density options exist within each group. In cereal, fresh dairy, prepared meals, and snacks, the upper end of the NRF6.3 range for products designated as Nova 4 exceeded that of non-Nova 4 products, further demonstrating that some Nova 4 deliver equal or greater nutrient density than less-processed counterparts within the same food category.
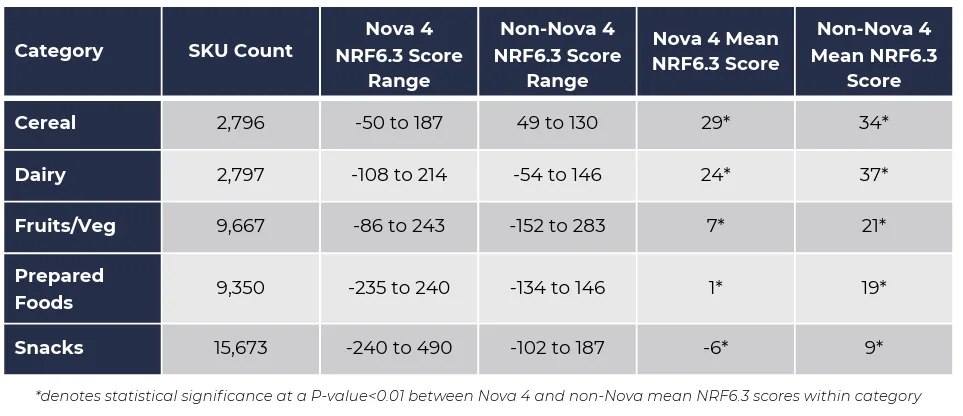
In the cereal category, for example, nutrient density illustrates why processing classification alone can be misleading regarding nutrition and/or healthfulness. The average NRF6.3 score across all cereals is 30, yet 837 cereals classified as Nova 4 score above this benchmark compared with 329 non-Nova 4 cereals. Moreover, the highest-scoring Nova 4 cereals exceed the top non-Nova 4 cereal by nearly 60 NRF6.3 points. These findings highlight that many Nova 4 cereals deliver meaningful nutritional value while also offering the variety, affordability, and accessibility that may support real-world consumer needs. These data for the remaining four food categories are available in Appendix B.
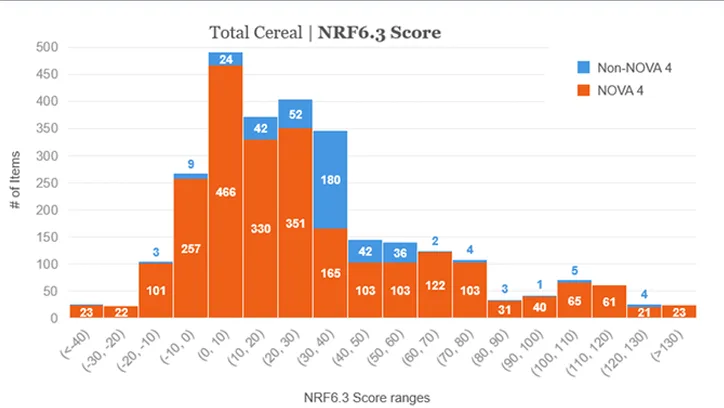
In total, this analysis of more than 40,000 products sold in U.S. grocery outlets reinforces that Nova classification alone does not reliably indicate nutrition quality. When nutrient density overlaps broadly across Nova 4 and non-Nova 4 products within categories, processing classification alone offers limited value for guiding food choices in building healthy dietary patterns.
Dollar sales as well as unit sales data reflect more than processing status, with category context, nutrient density, and price each shaping outcomes in different ways.
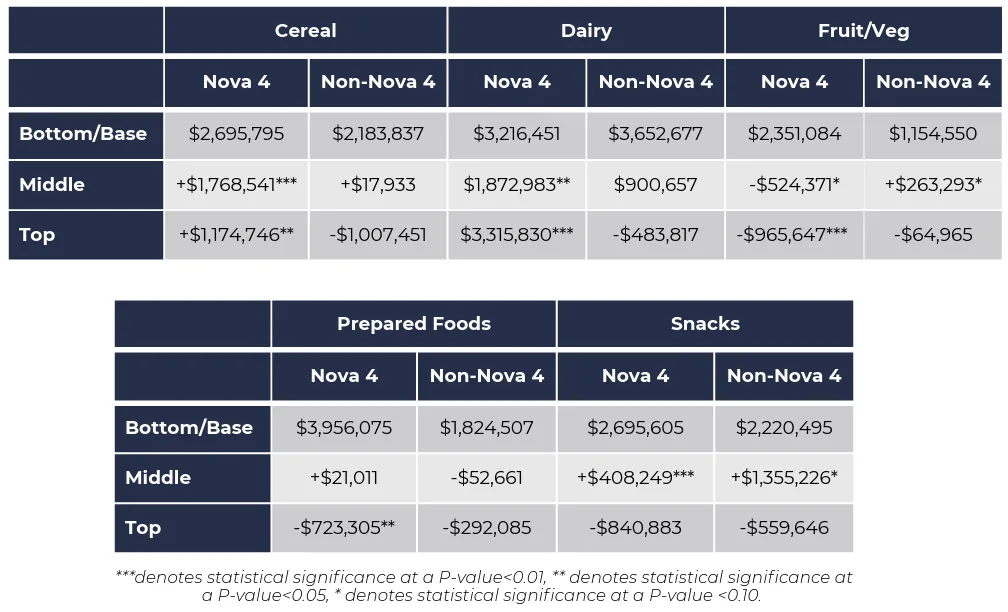
In a portion of this research, all products within a food category were divided into tertiles of NRF6.3 scores (lowest, middle, and highest) and then separated by Nova 4 or non-Nova 4 classification to examine the nutrient density of Nova and nonNova 4 products by sales. This analysis found that in the highest tertile of nutrient density scores, patterns varied across food categories. In the dairy category, Nova 4 classified items accounted for a higher share of available items than non–Nova 4 items (19.64 vs. 13.64) and a higher share of dollar sales (28.97 vs. 9.74).
This was also true in the cereal category, where Nova 4 products represented a substantially larger share of both items available (27.08 vs. 5.94) and dollar sales (31.29 vs. 2.09) than non–Nova 4 products. . In contrast, in the fruit and vegetable category, non–Nova 4 items accounted for a much larger share of both available items (26.21 vs. 7.05) and dollar sales (18.73 vs. 6.40). Similar patterns were observed in snack foods and prepared foods, where non–Nova 4 items represented a larger share of items in the highest nutrient density tertile (16.05 vs. 17.28 in snacks; 6.21 vs. 27.12 in prepared foods) and a larger share of dollar sales (10.48 vs. 12.60 in snacks; 2.69 vs. 24.76 in prepared foods), although Nova 4 products still accounted for a substantial portion of purchases within these categories. These findings indicate that both Nova 4 and non-Nova 4 play a role in meeting consumers’ preferences for taste, price, healthfulness, and convenience—factors that the IFIC Food & Health Survey has identified as key drivers of food choice for the past two decades. 8
These findings indicate that both Nova 4 and non-Nova 4 play a role in meeting consumers’ preferences for taste, price, healthfulness, and convenience—factors that the IFIC Food & Health Survey has identified as key drivers of food choice for the past two decades.
In continued assessment of sales based on Nova classification and nutrient density, a regression analysis compared average product sales in the middle and top NRF6.3 score tertiles relative to a bottom tier baseline, stratified by Nova 4 and non-Nova 4 classification. Results show that in the cereal and dairy categories, Nova 4-classified products in both the middle and top nutrient density tiers have significantly higher sales than the base tier on average, whereas non-Nova 4 products show mixed patterns. In contrast, Nova 4 prepared meals and fruits and vegetables exhibit significantly lower sales in the top nutrient density tier relative to the base, suggesting different market dynamics within these categories. Snack foods display higher sales in the middle tier for both Nova 4 and non-Nova 4 products yet declines at the top tier. Collectively, these findings illustrate that nutrient density alone does not consistently predict sales performance and that category context plays an important role in how consumers respond to foods across the nutrient density and processing spectrum.
Non-Nova 4 foods carry a consistent price premium relative to Nova 4 foods across total food and beverage, national brands, private brands, and multiple departments.
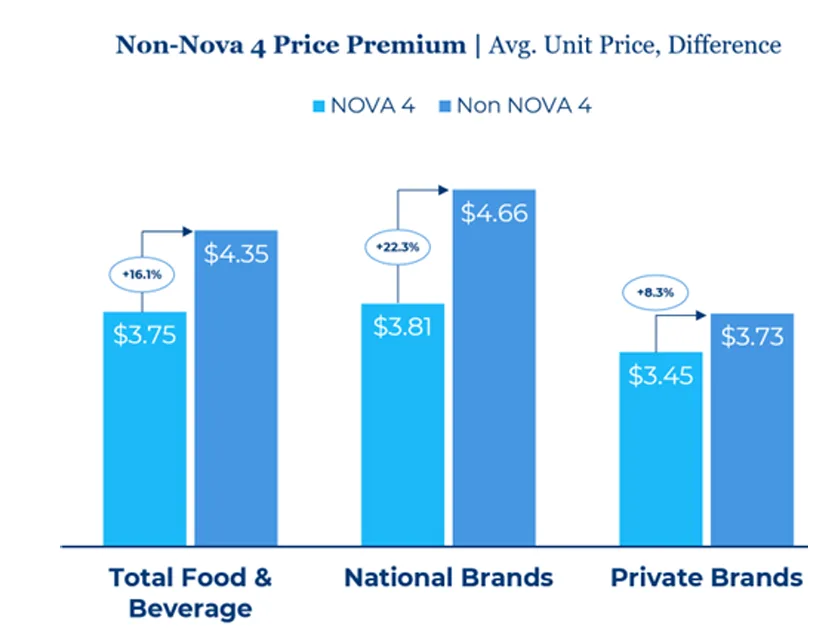
Across total food and beverage purchases, non-Nova 4 foods have a higher average unit price than Nova 4 foods, with a premium of approximately 16%. This price differential is more pronounced among national brands, where non-Nova 4 products are priced roughly 22% higher on average, and remains evident, though smaller, among private brands at approximately 8%.
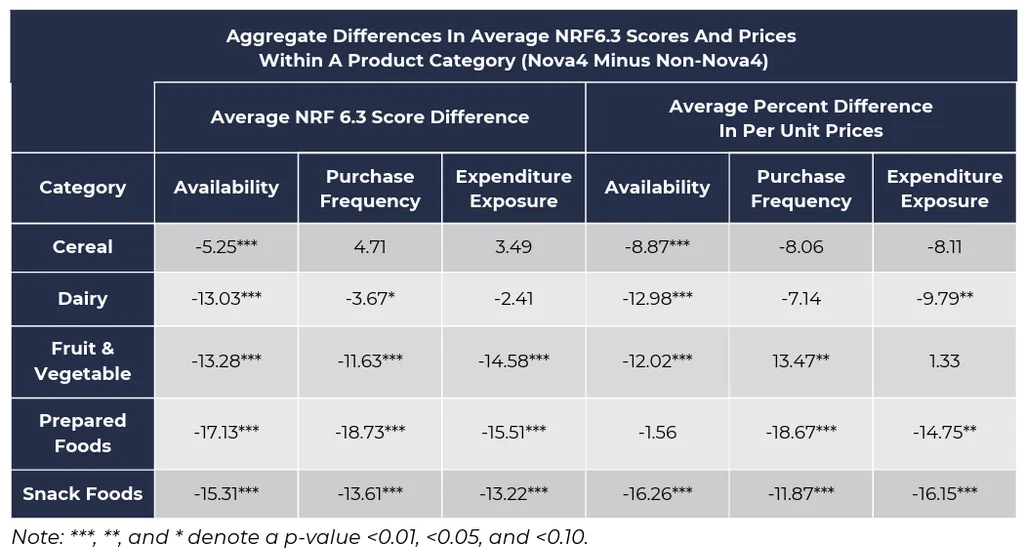
In the five categories studied in detail, regression analysis provides additional insight into how nutrient density and affordability differ between products classified as Nova 4 and non-Nova 4, both in aggregate and across nutrient density tertiles. For all products within a category (an indication of all products available in the marketplace), non-Nova 4 products exhibited higher NRF6.3 scores, particularly in dairy, fruit and vegetables, prepared meals, and snacks. When purchase frequency (units sold) and expenditure exposure (total dollars) were incorporated, category-specific patterns emerged. In cereal, Nova 4 products had higher nutrient density scores when weighted by units sold (+4.7 points) and consumer spending (+3.5 points) compared to non-Nova 4 cereals and were also priced 8.5% lower based on purchasing frequency and expenditures models. In contrast, dairy, fruit and vegetable, prepared meal, and snack categories maintained lower average NRF6.3 scores among Nova 4 products across specifications. Across categories overall, non-Nova 4 products were consistently more expensive, with Nova 4 products priced from 7.5% to 10.5% lower in dairy and up to 18% lower in snacks, reinforcing a measurable affordability differential across processing classifications.
Across total food and beverage purchases, non-Nova 4 foods have a higher average unit price than Nova 4 foods, with a premium of approximately 16%. This price differential is more pronounced among national brands, where non-Nova 4 products are priced roughly 22% higher on average, and remains evident, though smaller, among private brands at approximately 8%.
In the five categories studied in detail, regression analysis provides additional insight into how nutrient density and affordability differ between products classified as Nova 4 and non-Nova 4, both in aggregate and across nutrient density tertiles.
For all products within a category (an indication of all products available in the marketplace), non-Nova 4 products exhibited higher NRF6.3 scores, particularly in dairy, fruit and vegetables, prepared meals, and snacks. When purchase frequency (units sold) and expenditure exposure (total dollars) were incorporated, categoryspecific patterns emerged. In cereal, Nova 4 products had higher nutrient density scores when weighted by units sold (+4.7 points) and consumer spending (+3.5 points) compared to non-Nova 4 cereals and were also priced 8% lower based on purchasing frequency and expenditures models. In contrast, dairy, fruit and vegetable, prepared meal, and snack categories maintained lower average NRF6.3 scores among Nova 4 products across specifications. Across categories overall, non-Nova 4 products were consistently more expensive, with Nova 4 products priced from 7% to 10% lower in dairy and up to 16% lower in snacks, reinforcing a measurable affordability differential across processing classifications.
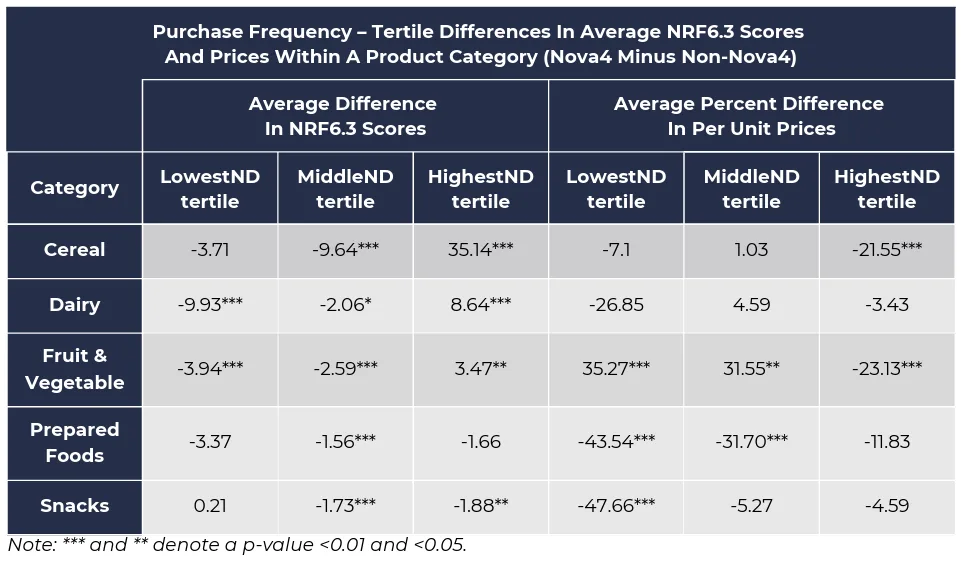
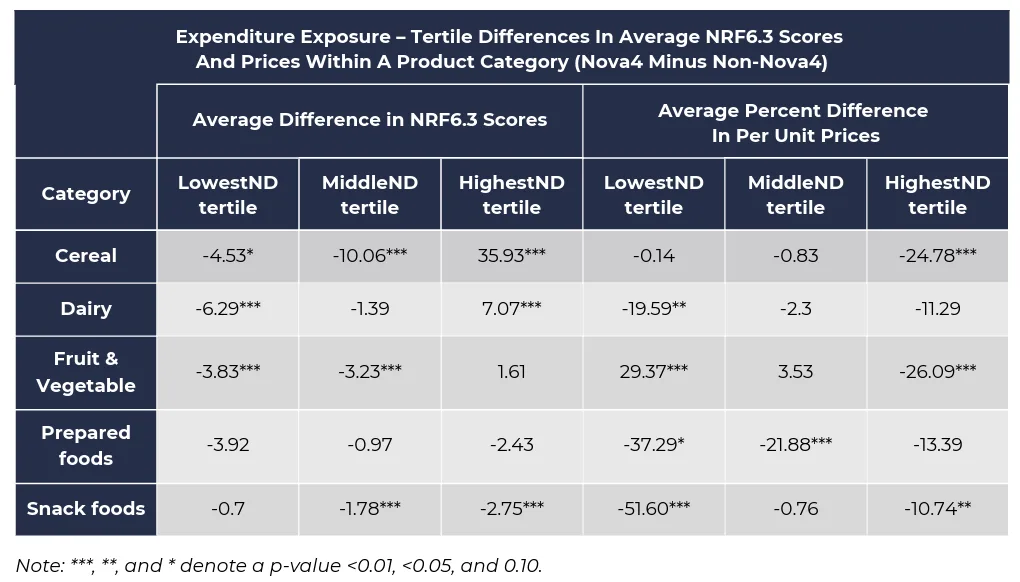
Dividing products into low, medium, and high nutrient density tertiles, as was done earlier in this report, provides a more nuanced understanding of where differences emerge in which products are purchased based on units sold and total expenditures within each product category.
Cereal: When weighting by purchasing frequency and expenditure exposure, Nova 4 cereals in the highest nutrient density tertile had NRF6.3 scores 35-36 points higher than non-Nova 4 cereals and were 22–25% less expensive than non-Nova 4 cereals. These findings indicate that among the cereals that consumers most frequently purchase and spend on, higher-nutrient-density Nova 4 options are both nutritionally stronger and more affordable.
Dairy: Nova 4 products in the highest tertile had NRF6.3 scores 7-9 points higher than those of non-Nova 4 dairy products, and while not statistically significant, also had 3-11% lower prices in the highest tertile. This suggests that in dairy, higher-nutrient-density Nova 4 options remain price competitive relative to non-Nova 4 alternatives.
Fruit and Vegetables: For fruits and vegetables, the pattern differs. In the highestscore tertile, Nova 4 products showed a modest NRF6.3 advantage in the purchasefrequency model (+3.5 points), whereas differences were small and not statistically significant in the expenditures model. Importantly, Nova 4 products in the highest tertile were approximately 23–26% less expensive than non-Nova 4 products in both specifications.
Prepared Meals: No statistically different NRF6.3 scores were observed between Nova 4 and non-Nova 4 categories in both purchasing and expenditure models. However, Nova 4 prepared foods were consistently less expensive, particularly in the low and medium tertiles. In the highest tertile, price differences narrowed and were not consistently statistically significant. This indicates that while nutrient-density advantages were limited, affordability differences remained pronounced.
Snacks: Nova 4 products in the highest tertile had NRF6.3 scores 2–3 points lower than non-Nova 4 snacks in both models, and Nova 4 snacks were generally less expensive across tertiles.
Together, these findings underscore the importance of considering affordability alongside nutrition quality when evaluating Nova 4 and non-Nova 4 food choices in real-world purchasing contexts. Importantly, examining products within nutrientdensity tertiles reveals patterns not visible in aggregate analyses, demonstrating that the relationship among processing classification, nutrition quality, and price differs meaningfully across the distribution of products. IFIC consumer research shows that taste and price are the leading drivers of food and beverage decisions, underscoring the importance of considering affordability, preferences, and access when discussing dietary guidance, food reformulation, and consumer-facing messaging related to food processing and nutrition quality.
Conclusion
Across five major categories, Nova 4-classified products account for a substantial share of U.S. retail purchases. At the same time, NRF6.3 nutrient density scores span from strongly positive to strongly negative within both Nova 4 and non–Nova 4 classifications. While the Nova system was not designed to serve as a measure of nutrient density, this variation highlights that foods classified within the same processing category can differ substantially in their nutrient profiles, suggesting that processing classification alone does not fully characterize the nutritional contribution of foods to overall dietary patterns. Additionally, analyses incorporating purchasing frequency or the expenditure exposure across nutrient-density tertiles demonstrate that both nutritional differences and affordability patterns vary meaningfully across categories, Nova 4 and non-Nova 4 classification, and the nutrient-density spectrum. These findings underscore the importance of evaluating processing classification, nutrient quality, and price together when considering dietary guidance communication and healthful dietary behaviors aimed at improving overall diet quality. A category-based nutrient density lens, paired with realistic shopping and eating contexts, may provide clearer guidance for consumers and more precise leverage points for communications, reformulation, and product positioning.
Future research expanding this approach across additional store categories would help provide a more comprehensive understanding of how processing classification, nutrient density, and affordability interact across the full retail food environment and support more actionable guidance for consumers and stakeholders.
Acknowledgements & References
IFIC thanks Dr. Brandon R. McFadden, Professor and Tyson Chair in Food Policy Economics in the Department of Agricultural Economics & Agribusiness at the University of Arkansas for his additional research and analytical contributions to this report.
References
1.International Food Information Council. (2025). Processed foods: Insights from consumer commentary. https://ific.org/research/processed-foods-insights-from-consumercommentary/
2.Monteiro, C. A., Cannon, G., Levy, R. B., et al. (2019). Ultra-processed foods: What they are and how to identify them. Public Health Nutrition, 22(5), 936–941. https://doi.org/10.1017/S1368980018003762
3.Braesco, V., Souchon, I., Sauvant, P., et al. (2022). Ultra-processed foods: How functional is the NOVA system? European Journal of Clinical Nutrition, 76(9), 1249–1253. https://doi.org/10.1038/s41430-022-01099-1
4.Gibney, M. J., Forde, C. G., Mullally, D., & Gibney, E. R. (2017). Ultra-processed foods in human health: A critical appraisal. American Journal of Clinical Nutrition, 106(3), 717–724. https://doi.org/10.3945/ajcn.117.160440
5.Fulgoni, V. L., III, Keast, D. R., & Drewnowski, A. (2009). Development and validation of the Nutrient-Rich Foods Index: A tool to measure nutritional quality of foods. The Journal of Nutrition, 139(8), 1549–1554. https://doi.org/10.3945/jn.108.101360
6.Drewnowski, A., & Burton-Freeman, B. (2020). A new category-specific nutrient rich food (NRF9f.3) score adds flavonoids to assess nutrient density of fruit. Food& Function, 11(1), 123–130.
7.Roemmich, J. N., Nelson, A. M., Stice, E., Hess, J. M., Palmer, D. G., & Casperson, S. L. (2025). Efficacy of a web-based executive function trainingprogram to induce healthier food choices and increase valuation of fruits and vegetables in adults: Protocol for a randomized controlled trial. JMIR Research Protocols, 14,e66394.
8.International Food Information Council. (2025). 2025 IFIC food and health survey. https://ific.org/research/2025-ific-food-health-survey/
Appendix A: NIQ Database Subcategories Of Five Food Categories Analyzed
Cereal: Chilled cereal. Hot cereal, RTE cereal Fresh
Dairy: Almond milk, Blends, Coconut milk, Cow’s milk. Greek yogurt, Icelandic yogurt, Lactose reduce/ free milk, Milk shakes/ smoothies, Nondairy yogurt, Oat milk, Powdered milk, Rice milk, Smoothies, Soy milk, Diary yogurt
Fruits/Vegetables: Apple cider, Applesauce, Apples, Apricots, Artichokes, Asparagus, Avocados, Bananas, Beans, Bell peppers, Black beans, Blackberries, Blackeyed peas, Blueberries, Broccoli, Brussel sprouts, Cabbage, Cannellini beans, Carrots, Cauliflower, Cherries, Chickpea/ Garbanzos, Chili peppers, Coconut, Cooking greens, Corn, Cranberries, Cranberry beans, Cranberry sauce, Crowder pea, Cucumbers, Currants, Dates, Dipped/covered fruit, Dried beans, Eggplant, Fava beans, Field pea, Figs, Fruit cocktail, Fruit juice, Fruit salad, Fruit/veg blend, Garlic, Grapefruits, Grapes, Great Northern beans, Green beans, Kale, Kidney beans, Kiwi, Lemons, Lentils, Lima beans, Lupini bean, Mandarins, Mangos, Mixed berries, Mixed fruit, Mixed vegetables, Mushrooms, Navy beans, Nectarines, Onions, Oranges, Papayas, Peaches, Pears, Peas, Peruvian bean, Pigeon peas, Pineapples, Pink beans, Pinto beans, Plums, Pomegranate, Potatoes, Prunes, Pumpkins, Purple hull peas, Raisins, Raspberries, Root vegetables, Sauerkraut, Sides, Soybeans, Specialty frozen vegetables, Specialty fruits, Spinach, Sprouts, Squash, Strawberries, Tangerines, Tomatoes, Tropical fruit mixes, Variety pack, Vegetable juice, Watermelons, White beans
Prepared Meals: Appetizer, Appetizer party platter, Blintzes, Breakfast meals/ combos, Breakfast meat, Breakfast sandwich, Calzone/ stromboli, Canned meat, Complete meal, Dry mixes, French toast, Frittata, Handheld entrees, Lasagna, Mac and cheese, Main course, Meal kit, Multi-serve, Omelets, Other deli breakfast foods, Pancake, Pasta, Pot pie, Quiche, Salads, Sandwiches, Sides, Single serve, Soup, Stew, Sushi, Veg/salad starter, Waffle
Snacks: Bagel chip, Cereal & granola bars, Cheese snacks, Cookie & cracker variety packs, Cookies, Cookies combination packs, Corn chips, Cracker chip, Crackers, Crackers combination packs, Health/ nutrition bars, Meat snack, Multigrain snack, Nuts, Onion snack, Piece, Pita chip, Popcorn, Pork rind, Potato chip, Pretzel, Pretzel chip, Rice cake, Rice chip, Roll, Seafood snack, Seeds, Shapes, Snack mixes, Specialty cookies, Specialty dried bread, Strip/bar, Tortilla chip, Twist/rope, Variety pack, Vegetable based salty snacks
Appendix B: Category NRF6.3 Score Distributions